Introduction to the Sao Tome and Principe model
(Need-based projection model)
The Sao Tome and Principe model is a typical example of the projection tools that can be developed to assess the financial and practical feasibility of the policies envisaged in an Education Sector Plan.
It is typically developed by the MoE Planning Division, in coordination with the other divisions (ECE, basic education, secondary, higher education, HR, infrastructure, teacher training, etc.), and with support from external technical assistance. It offers a great flexibility in the way needs can be projected and costs estimated.
As a tool for the development of a sector-wide strategy, such need-based projection models normally cover all education subsectors, from ECE to higher education. The example provided focuses on the ECE section of the model. It is built upon a baseline year, which is the most recent year for which the necessary data, or best estimates, (in terms of funding, costs, enrolments, teachers…) are available.
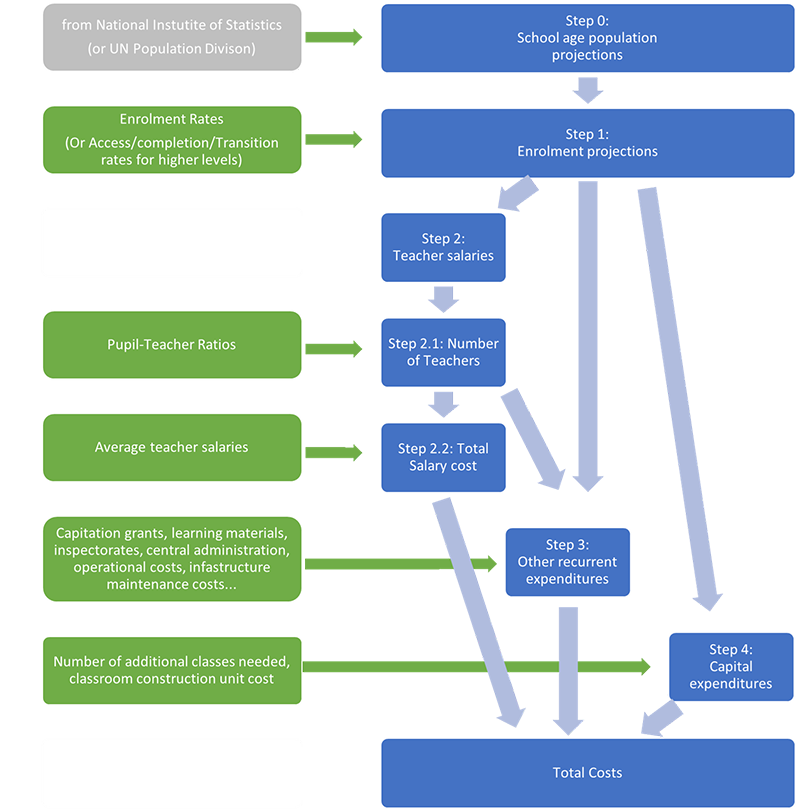
The first step of the projection is to decompose the education expenses into key elements. The level of details in this decomposition will depend on the information available and the policies envisaged : it should include the main aspects of the education sector that will be impacted by these policies directly (teacher recruitment, training and/or remuneration, construction of classrooms…) or indirectly (enrolments, maintenance costs…), or evolve externally (e.g. school age population).
Keeping in mind that financial simulations are uninformative when they are too rough, and generally wrong when they try to be too precise, they essentially lay somewhere between two extremes:
- The projection of the costs as the multiplication of the unit cost (expenditure per student) (based on the budget spent on ECE divided by the number of learners) by a target number of learners.
- The costing of every policy and activity in the Strategic Plan.
The typical financial simulation will be based on:
- The salary cost for teachers, itself calculated based on the expected number of pupils, the teacher-student ratio and the teacher salaries.
- An estimation of the other recurrent costs. This is where different levels of details will be envisaged based on the policies and the information available.
- An estimation of the infrastructure costs.
A special attention is given to the total cost of teacher salaries, as they usually represent 80-95% of the recurrent costs of any education level.
As indicated, the choice of level of detail will be driven by the need to simulate the impact of some key, large cost policies, and constrained by the data available: to project the cost of a policy, one will need to know the cost structure of the current situation . For instance, if the policy calls for equipping each KG class with play materials, one will ideally need to know the current budget allocated to learning/play materials; if this information is not available, one will need to project the costs of these new materials together with the goods and services budget. Tool 2.3: List of Core ECE Cost and Financing Indicators and Variants highlights the key data needed to develop projection models with varying level of details based on the data available and estimates that may be made.
Click on the video to see how to navigate through the simulation model example.