Tool 3.2: Criteria, Recommendations and Checklists
Defining ECE Indicators and Target Setting

© GPE/Carolina Valenzuela
Introduction
After you have identified ECE strategies and related activities, you will need to create mechanisms to monitor and evaluate their use. This tool helps define specific indicators and set crucial targets.
This tool builds on the guidance provided in the MOOC modules and the IIEP-UNESCO and GPE’s Guidelines for Education Sector Plan Preparation, and presents criteria and considerations for defining ECE impact, outcome, output and activity indicators for the respective ECE goals, strategies, outputs and activities. It also suggests considerations for setting ECE targets.
Note that the indicators and preliminary targets agreed to in the programme design phase (i.e., when developing strategies and activities) are adjusted throughout the planning process and as different feasibility checks are conducted, including financial simulations. This tool may be used throughout this iterative process.
Objectives
Using this tool will enable ECE Technical Working Group (TWG) stakeholders to:
Understand considerations and apply criteria for defining ECE indicators to be included in the ESP Results Framework and related operational plans;
Understand and apply considerations for setting ECE targets.
When to Use this Tool
After ECE policy priorities and related strategies and activities have been identified, this tool may be used in conjunction with the guidance from the MOOC modules and the IIEP-UNESCO and GPE’s Guidelines for Education Sector Plan Preparation to support the ECE TWG stakeholders to:
- Define ECE indicators across the results chain hierarchy during the programme design phase and adjust post-simulations.
- Set targets aligned with the results chain hierarchy and related to indicators prior to and post-simulations.
- Define ECE indicators for the ESP’s corresponding operational plans at the time of operational planning (multi-year and/or annual operational plans).
- Understand different considerations when choosing indicators (e.g. SMART criteria, alignment with policy outcomes, inclusivity).
This tool may also be used by individual institutions or country clusters/LEGs that manage and/or directly provide ECE services in countries affected by emergencies or conflicts, to identify ECE strategies’ and activities’ indicators and targets in ECE specific proposals and response plans or as part of broader Education in Emergencies response plans, proposals, joint response frameworks and/or Transitional Education Plans.
Key Information
Because, in most contexts, the ECE components are embedded within the Education Sector Plan (ESP), it is essential to understand how the overall ESP Results Framework is developed and how ECE fits in.
Monitoring and evaluation (M&E) mechanisms are essential to ensure that the ESP is on track to achieving its objectives. During the ESP development phase, indicators and targets are developed to inform the ESP Results Framework. The ESP Results Framework is aligned with the structure and organization of the goals, strategies and activities (i.e. logframe approach). As you develop the ECE subsector’s components for the ESP, you will need to use a similar process for ECE-related indicators and targets.
For background information on developing indicators and targets, please refer to:
- MOOC Module 4, Section 3.3, Page 16;
- MOOC Module 5, Sections 3.3.1 and 3.3.2; and
- IIEP-UNESCO and GPE’s Guidelines for Education Sector Plan Preparation (p.18-19, 27).
MOOC Module 5 specifies that:
- The ESP results framework transforms the results chain of an intervention into indicators that measure the degree to which results at various levels are achieved.
- For each result in the ESP, the results framework provides a specific indicator, along with its baseline, and intermediate and final targets, as well as the source of information, its frequency (in term of data collection) and the unit responsible for reporting.
- The ESP results framework also has a narrative component that describes methodology, how the monitoring will be undertaken, and the means of verification and accountabilities assigned to different individuals and agencies.
- It is important to also determine the calculation methodology, indicator definitions, and ways indicators will be disaggregated even if this level of detail is outlined in a separate document. For example, defining what “teachers’ capacity” means, such as if it is the completion of a training course or demonstrating specific competencies in observations.
- In some cases, a planning/calendar matrix for key monitoring and evaluation activities is also provided. All these components form the ESP’s M&E framework or M&E plan, which has a dedicated section in the ESP.
Developing the Results Framework is initiated during the programme design phase. MOOC Module 5 Section 3 provides general guidance for developing the ESP Results Framework, including:
- general M&E concepts and purpose of M&E for the ESP (Page 9-10);
- the M&E cycle, reporting and review processes, and tools (Pages 11-13);
- the purpose of the M&E Results Framework for the ESP and indicators’ categorization based on the results chain hierarchy with examples (Pages 13-15);
- general considerations for indicator selection (i.e. use of SMART criteria, measure what they are supposed to measure or validity, and alignment with the goal or objective of an education sector plan or relevance) (Page 16, Page 26);
- Key Performance Indicators’ definition, purpose, selection considerations, and examples (Pages 16-18).
Examples of ECE components in an ESP Results Framework:
Example 1: The following is the results framework for the ECE subsector in Uzbekistan’s Education Sector Plan (2019-2023). It consolidates into one matrix all the indicators across the hierarchy of indicators, from impact-level (goal) through input-level (activities). Note that this is an illustrative example format of the components of the Results Framework and not the typical ESP Results Framework format.
| Impact (long term, wide spread effects) |
|
|---|---|
| Outcome (intended results of plan/projects |
|
| Outputs (products & services created / accomplished) |
|
| Processes / Activities executed by Govt/community/private |
|
| Inputs (financial, physical, material & human resources) |
|
Example 2: The following is a snapshot of a results matrix for the ECE programme in the Solomon Islands’ National Education Strategic Framework (2016-2030), and reiterated in the National Education Action Plan (2016-2020). This result matrix identifies the (i) goal for the ECE subsector; (ii) the objectives that must be achieved to achieve the goal; and (iii) the primary outcomes that must be attained to meet these objectives. SMART indicators (see information below on SMART criteria) are provided, along with their baseline and final targets.
A separate Monitoring and Evaluation Plan (2017-2020) was developed, with a detailed narrative to ensure rigorous and realistic monitoring of the outputs of the National Education Action Plan (2016-2020). The full results framework is provided in its Annex A.
General Guidance on Defining Indicators
The MOOC Module 4 Section 3 (Pages 13-16) outlines the Logframe Approach (LA), its structure and elements, including how to define the ESP’s Results Framework indicators and targets, which are:
- part of the ESP program design phase (i.e., when developing strategies and activities),
- revised post-simulation,
- and refined further when developing a Results Framework for the ESP.
The IIEP-UNESCO and GPE’s Guidelines for Education Sector Plan Preparation (p. 26-27) also provide additional general guidance on defining indicators and developing the ESP results framework. For examples of ECE indicators applied across the results chain hierarchy in the ESP and corresponding operational plans, please see MOOC Module 5 Table 3 (Page 15) and Tool 4.1: Recommendations: Ensuring Strong ECE Components in the Operational Plan.
Key ECE Indicators: Examples
The MOOC Module 4 (Page 16) discusses how the selection of indicators is part of both a technical and political process and may need to be negotiated based on government’s policy priorities and other non-governmental institutions’ priorities (i.e. private or civil society service providers).
Refer to Tool 2.1: Spreadsheet: ECE Data Mapping and Evidence Plan for a comprehensive list of ECE indicators, many of which are outcome indicators. Priority indicators are standardized indicators, and other non-priority indicators may be adapted to fit the context. The indicators in this spreadsheet are organized across core function areas and may be a starting point to define outcome-level indicators to measure ECE strategies in the ESP Results Framework, as Key Performance Indicators for the ESP and/or included in related operational plans. Each country’s context is different, and this list is not intended to be used in its entirety. Your ECE TWG can consider which specific indictors may best connect with the strategies and activities previously identified.
For example, a selection of outcome indicators across Core Function 2: Curriculum Development and Implementation, Core Function 3: Workforce Development, and Core Function 5: Quality Assurance, may be considered to define outcome indicators to measure a strategy prioritized on improving school readiness.
Activities such as the following would require output and activity level indicators to be developed:
- revising the national curriculum,
- conducting pre- and in-service teacher training on the revised curriculum,
- and revising inspectorate protocol to include observations on the revised curriculum’s implementation.
Targets are included in the ESP results framework and monitored annually. Refer to the MOOC Module 4 Section 3 (Page 13) onwards with regards to understanding the Logframe Approach (LA) to programme design and how indicators and target setting are part of the design process.
As part of the ESP results framework development process, the ECE TWG may propose evidence-based ECE targets to stakeholders with decision-making authority. The targets should be consistent with SDGs, national policies, and elaborated using a participatory approach.
Targets should be set for indicators defined across all levels of the results chain hierarchy (i.e. impact, outcome, output, and activities). Indicators are typically defined first, then their targets set. For more information on targeting setting across levels of the results hierarchy with a pre-primary specific example, refer to the IIEP-UNESCO and GPE’s Guidelines for Education Sector Plan Preparation (Page 18-19).
Target setting is an iterative process. Simulations support refining and adjusting targets. For example, the ECE TWG may suggest that the ECE Net Enrolment Rate (NER) should rise from 50% to 80% in two years. If a simulation conducted with this target suggests this requires doubling the ECE budget, this information may help the ECE TWG working closely with decision-makers to lower the target and make it more realistic. As noted above, targets will also need to be set for strategies and activities.
Recommendations and Examples
This consideration applies to all targets and corresponding indicators – from the policy priority level to activities. See the Kenya Example below for an example of a smart Key Performance Indicator (a policy priority indicator) and its related target.
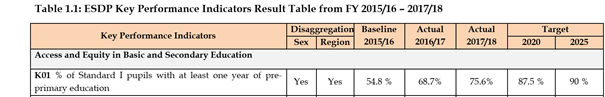
Here is an example of targets from the 2017 Kenya Education Performance Report.
Analysis of SMART Criteria in the Kenya Example
One informative criterion to consider in target setting – though not the ultimate deciding factor - is to check if targets correspond with SMART indicators. Looking at the Kenya example, your ECE TWG team might consider the following:
- Specific: First, this indicator is specific. It is written in a manner that is easily understood by everyone.
- Measurable: It’s measurable, because it refers to the number of pupils that enter grade 1 having at least one year of pre-primary education in the EMIS data forms at the school level. The enrolment forms ask parents if the child has been attending pre-school for at least one year.
- Attainable: This is a key question when defining targets. To check if the target is realistic in the Kenya case, we are going to use a graphical representation of the Kenya data above and then fictional data (see example below).
- Relevant: Yes, it is related to the Basic and Secondary Education Access and Equity agenda.
- Timebound: Yes, it’s timebound as there are 5 years (between 2020-2025) to achieve the target.
Trend analysis is important but is not the only consideration when determining targets. The example below illustrates how targets may be analyzed in conjunction with other important considerations, namely resource availability (human and financial).
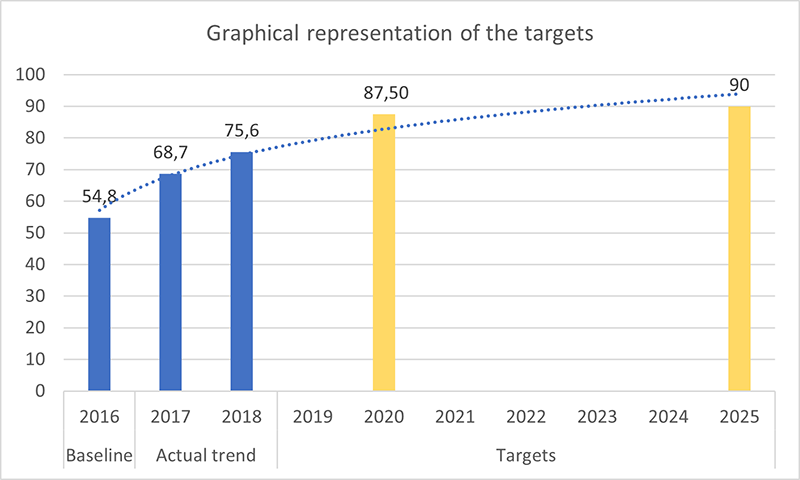
- Examine: Are targets approximately aligned with the projected trends? Look at the curve in this Excel graph. The curve is smooth, and the targets are approximately aligned with the projected trend (the first target is slightly above the actual trend and the second target is slightly below).
- Examine: When does enrolment increase the most? The least? The increase in the pupils enrolled in KG will happen mostly during the 2016-2020 period with a target value of 33 points. During the period from 2020 to 2025, the increase may be approximately 2.5% points.
- What other population characteristics may affect target achievement and why? This illustrates how when ECE enrolment is low, one can envisage rapid improvement. However, when enrolment is already high it is difficult to obtain fast gains because the remaining population to enrol likely has vulnerability characteristics which must be taken into account (e.g., the population may be from rural areas, households from the lowest socio-economic quintile, persons and/or children with disabilities, single-headed households, etc.).
- Is the target replicable across contexts? It is highly doubtful that this may be replicated in other contexts given the above characteristics that need to be taken into account.
Let’s simulate another example, this one of unrealistic targets, illustrating with the same baseline and trend data.
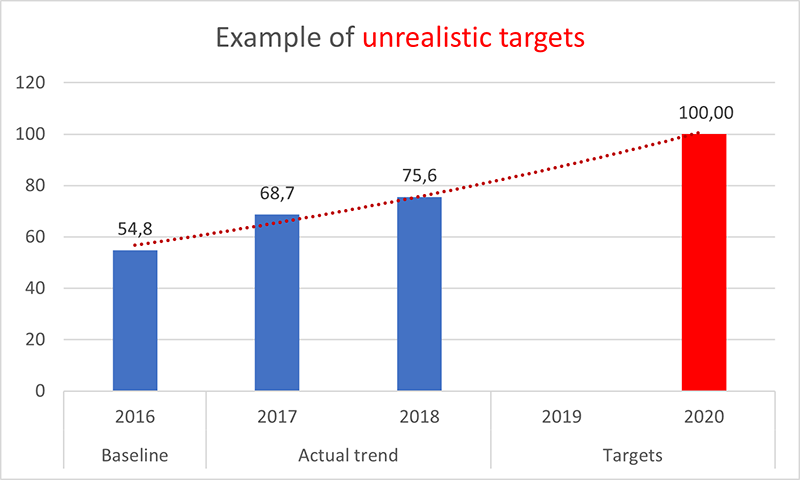
- What does the gain curve look like? Gradual or exponential? In this fictitious example, the level of participation in KG will reach 100% in 2020. The gain curve is exponential.
- Is the increase approximately aligned with the current trend, or far above the current trend? Between the years 2017 and 2018, the gain was 6.9 points but the target indicates a 25 point increase over two years corresponding to a 12.5 point increase per year, far above the current trend.
- What do you think? Is the target realistic based on the above? This target is not realistic. It is unlikely to achieve universal enrolment in ECE in the course of 2 years.
As suggested in MOOC Module 4 (Page 19) the cost of different scenarios “policy options” and corresponding targets must be determined, as these are crucial inputs needed for a simulation model.
A fourth consideration for ECE target setting is to use international benchmarks. This is most suitable at higher results levels (e.g. Impact, Outcome), where standardized indicators are more common. International benchmarks may also be an important advocacy tool when illustrating to decision-makers what is possible, based on the ECE achievements of successful countries with similar characteristics.
Let’s illustrate this approach with an example. The graph below provides data on share of education expenditure spent on ECE over the period 2013-2019 and the Early Child Development Index (ECDI) for the most recent years for those lower middle income countries where data is available.
Graph 1: Share of education expenditure spent on ECE over the period 2013-2019 and the Early Child Development Index (ECDI)
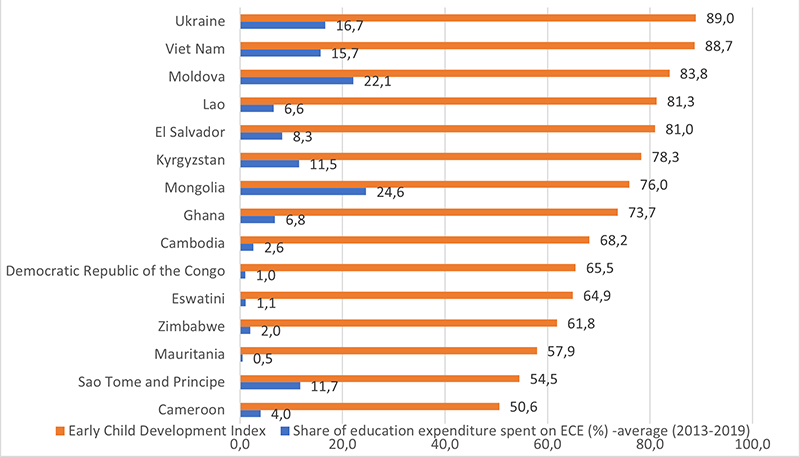
Lao spends 6.6% of its education budget on ECE, and the ECDI is 81.3. We can see that a neighboring country, Viet Nam, spends over double on ECE (15.7%) and the ECDI reaches 88.7. With the assumption that if a country’s expenditure positively influences child development outcomes measured by the ECDI, if Lao doubles its ECE budget, it could potentially reach the Viet Nam target (which would require a change in the country’s policy).